
 Neoclouds
 Neocloud Users
 AI Data Centers
 Enterprise Data Centers
 Visibility & Posture
 Verify Rented Capacity
 Risk Prioritization & Hardening
 Red Teaming & Pen Testing
 Runtime Detection & Response
 Compliance & Audit Readiness
 Blog


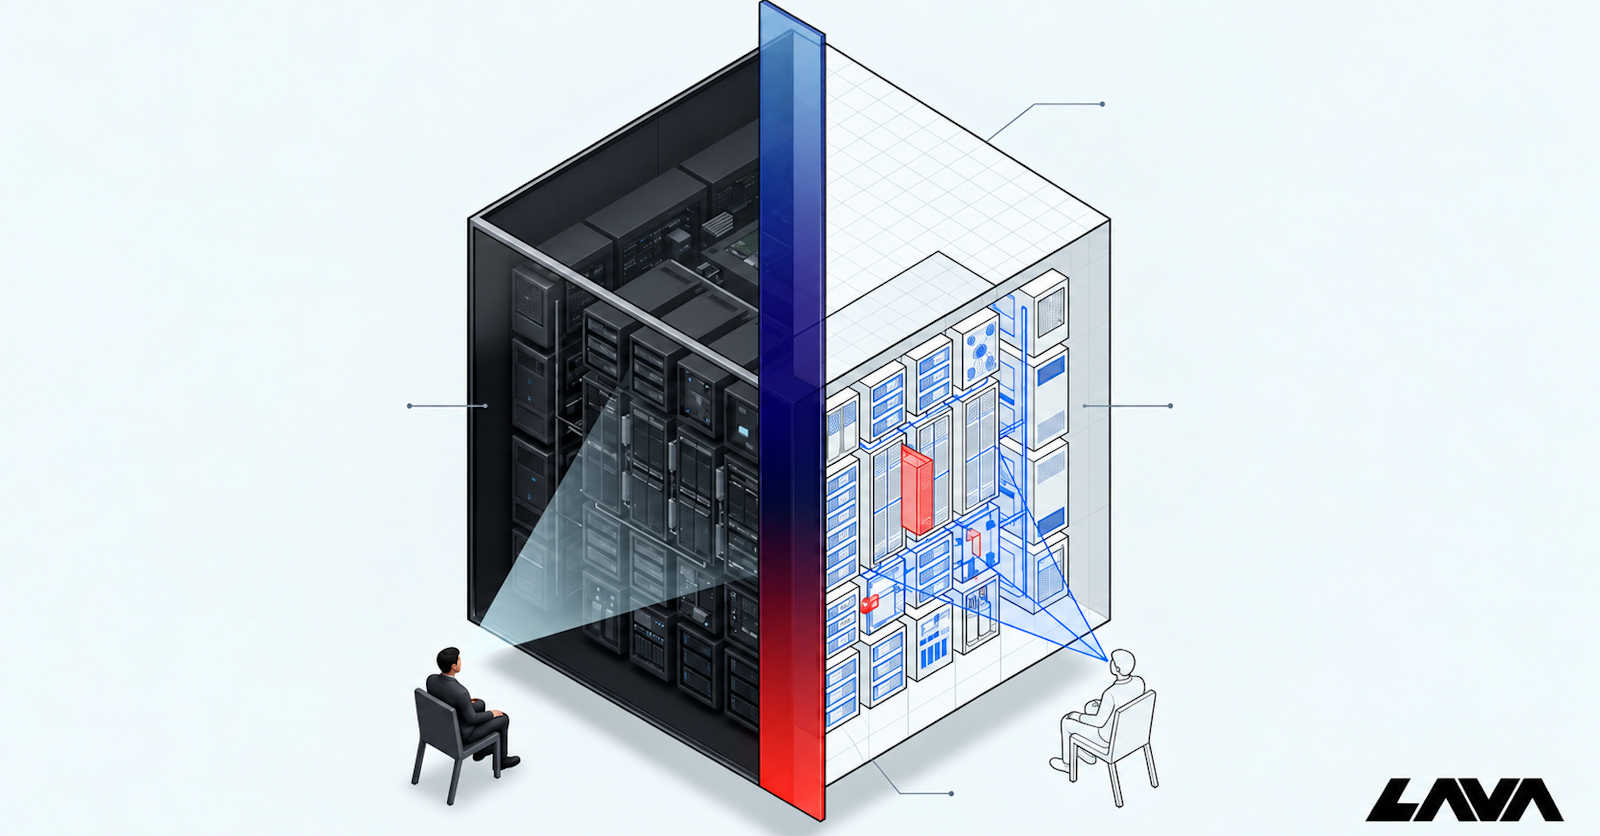
Bare metal is making a comeback, and it's bringing back a problem the cloud was supposed to have solved. AI teams training and serving frontier models rent GPU servers by the hour from neoclouds, and many neoclouds offer bare-metal access to those servers. The tenant gets root on a real machine, with no hypervisor between them and the hardware, no noisy neighbors sharing their cores, and no virtualization tax on a $30,000 GPU. The provider hands over the box, and gives up the ability to watch what happens inside it.
In a VM-based cloud, the provider controls the infrastructure beneath the guest OS. Bare-metal neocloud flips that trust boundary inward. Every interface the operator would normally trust to see what's running is served by an OS the tenant controls, and a compromised kernel can make all of them lie.
Even on an honest host, an in-band agent is a hard sell. GPUs rent for $2 to $10 an hour, and every cycle a security probe burns on the host CPU is one the tenant paid for and isn't getting. That leaves the provider blind to what's happening inside the hosts they operate, and the customer trusting them anyway.
A kernel compromise on bare metal also has more reach than one inside a VM. From the kernel, an attacker can flash firmware that survives every tenant handoff, pivot through the BMC into the provider's management network, or load rogue fabric drivers and shape other tenants' traffic. All three are among the top risks catalogued by FORGE, a security framework for AI infrastructure.
Anything the provider deploys on the host runs inside that same blast radius, subvertible by the kernel it's trying to watch. So the provider needs an observer that lives off the host, is provider-controlled, and cheap enough to run continuously. It reads the kernel without asking it, and without borrowing its CPU.
In this three-post series, we'll build one. If you operate a neocloud, or run high-end GPU servers of your own, the hardware we'll use is probably already sitting in your racks. Before we get to the vantage point, we need the technique it's going to use. This post covers the classical way, in its comfortable habitat, on a machine you own. The next two relocate it, first out to a device on the PCIe bus and then into a form deployable across any tenant kernel we've never seen. What does it mean to introspect a running Linux kernel?
Read the memory, don't ask the OS
Memory introspection means examining an operating system's state by reading its memory and interpreting the bytes as OS-level structures (processes, loaded modules, open sockets) rather than by asking the OS through the interfaces it exposes for that purpose. The technique works on both a captured memory image (a memory dump taken from a running system, or a kernel crash dump written after a panic) and a running kernel whose memory is being read as the system continues to run. The kernel data structures and the tools that walk them are the same in both. The difference is whether the bytes were captured at a moment in the past or are moving under you as you read them.
The provider's observer has to catch compromises as they happen, which rules out analyzing a captured image. But the reason memory introspection fits the trust problem at all is a property both settings share. An in-band tool asks the OS what's running, and the OS answers. A kernel-mode rootkit that filters or lies through those answers hides from it. A memory-introspection tool doesn't consult the OS. It reads kernel memory directly and reconstructs state from the bytes themselves. The kernel is the object of study, not the source of answers.
This post covers live introspection in the cooperative case. That means a machine we own, running a cooperating kernel, with root and matching kernel debug packages. Once we've covered the cooperative case, relocating it out to a device on the PCIe bus (post 2) and doing it against kernels we don't have debug packages for (post 3) will read as adjustments to a familiar picture rather than a leap.
Bytes, and how to interpret them
Turning raw memory into recognizable OS structures (a process, a loaded module, an open socket) is where memory introspection earns its name. Suppose we want to enumerate every process on the box, the same output ps produces but built from raw memory instead of syscalls.
Start with a single kernel object. The Linux kernel represents every running process as a struct called task_struct, and it keeps one specific task_struct, called init_task, as the head of a linked list containing all the others. Find init_task and every process on the box is reachable from there.
Finding it means knowing where in memory it lives. On a live host that's a single grep. /proc/kallsyms is a file the kernel exposes with every named global (variables, functions) in the running kernel and its address:
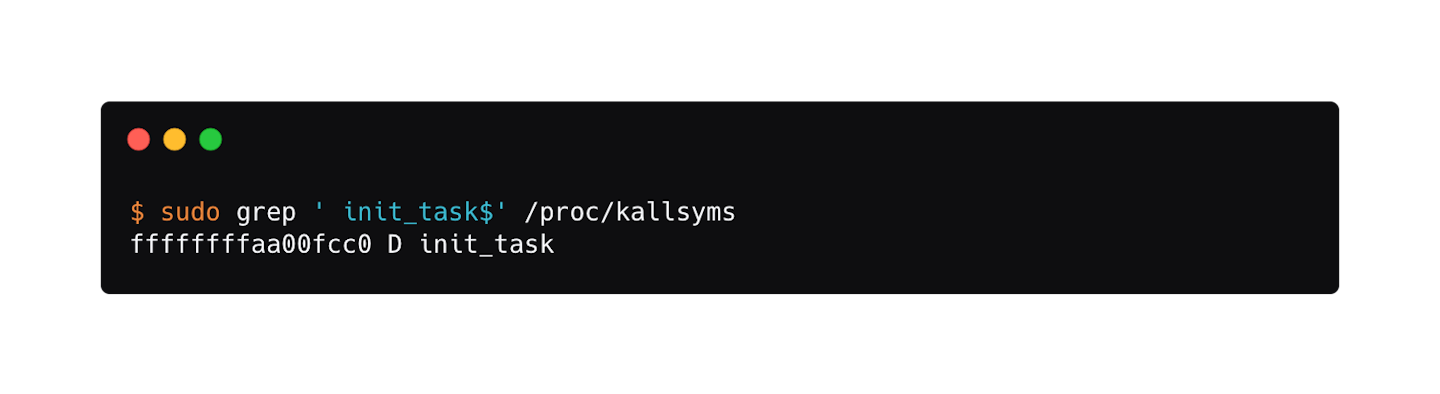
Having the address is not enough though. init_task is about 10 KB of raw bytes, with a process ID at some offset, the command name at another, a pointer to the next process at another. Nothing on the bytes themselves says where the fields start and end. Two different builds of the same kernel version can even put the same fields at different offsets, depending on how the kernel was configured at build time or which compiler version was used. Making sense of the region requires a description of its exact layout, and that description lives in the kernel's debug symbols (a format called DWARF).
The debug symbols ship as a distro package installed to match the running kernel (linux-image-*-dbgsym on Debian, kernel-debuginfo on Red Hat). With them, the layout of task_struct is fully knowable. Every field has a known offset, a known size, and a known type. Reading the region at init_task's address and applying the layout gives us the PID, command name, and next-process pointer of the very first task.
Once one task_struct is readable, the rest are reachable from it. Very few kernel objects have their own name in the symbol table, so almost everything else is reached by starting from one that does and following pointers from there. Enumerating every process on the system means starting at init_task, following the linked-list pointer to the next task_struct, then the next, and so on. Pointer following relies on the same layout description as reading fields did, since that description also says which fields are pointers and what kind of object each pointer leads to.
Reading a live kernel
With addresses from kallsyms and layouts from DWARF, fetching bytes at those addresses is the last thing to sort out. On a live Linux system, the answer is a single file called /proc/kcore.
/proc/kcore is what the kernel exposes to make its own address space look like an ELF core dump. The mapping from file offsets to memory addresses lives in the file's ELF program headers. Each PT_LOAD segment declares a range of kernel addresses and the file offset at which the bytes for that range start. Peeking at the headers on a live host shows the layout directly:
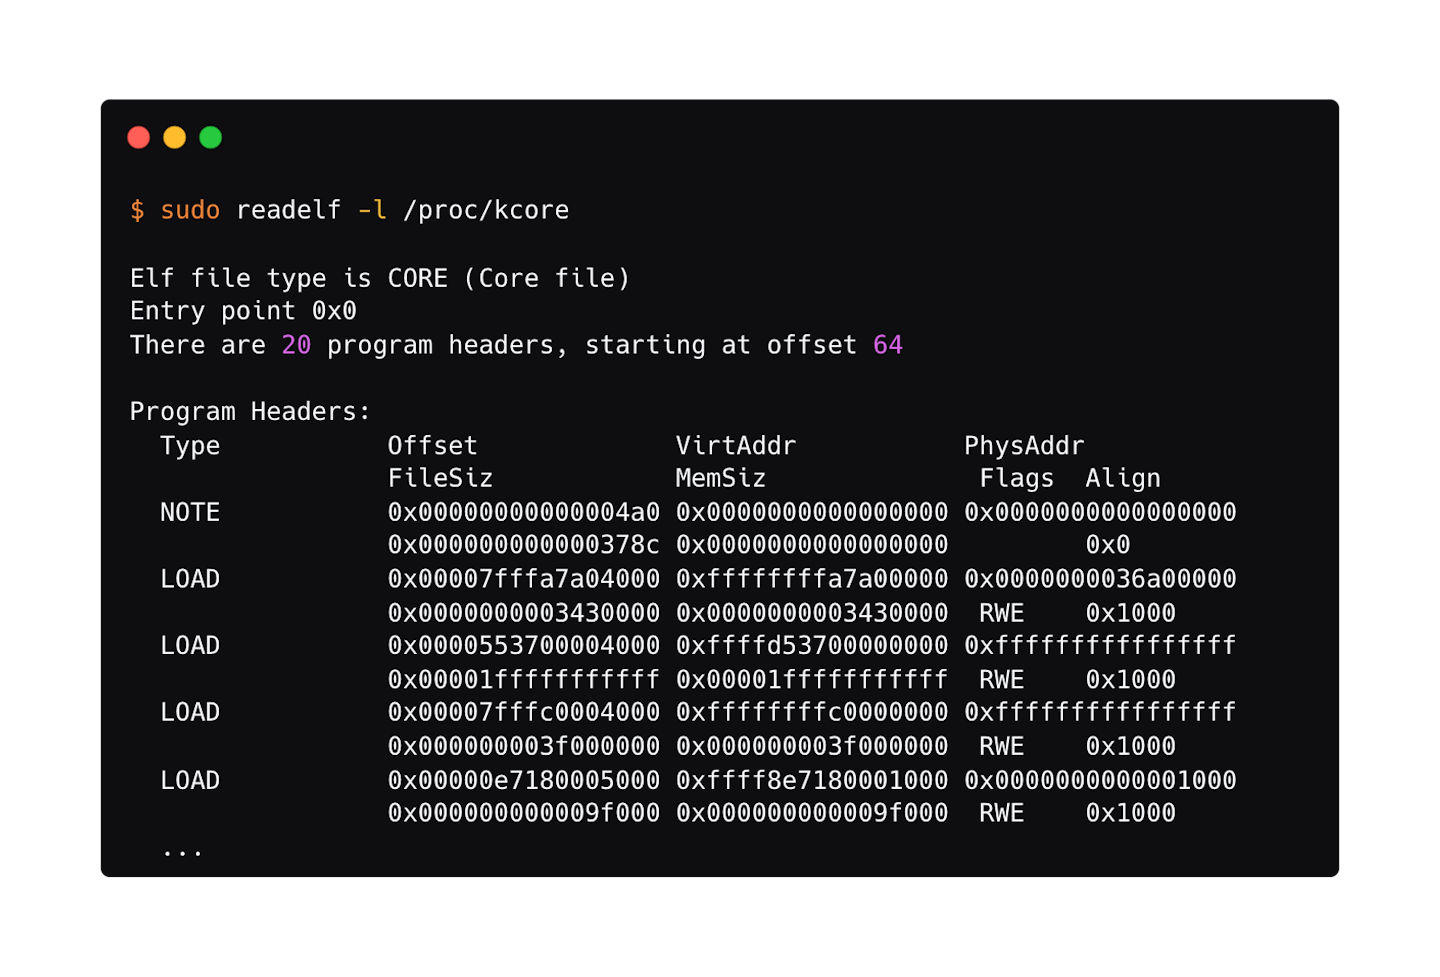
When something reads from /proc/kcore at a file offset, the kernel finds the PT_LOAD segment covering that offset, computes the corresponding kernel address, and reads the bytes at that address. Any process with root, and no lockdown mode blocking it, can do this for any mapped kernel address.
That's the whole interface. Ask for N bytes at address A and get N bytes back.
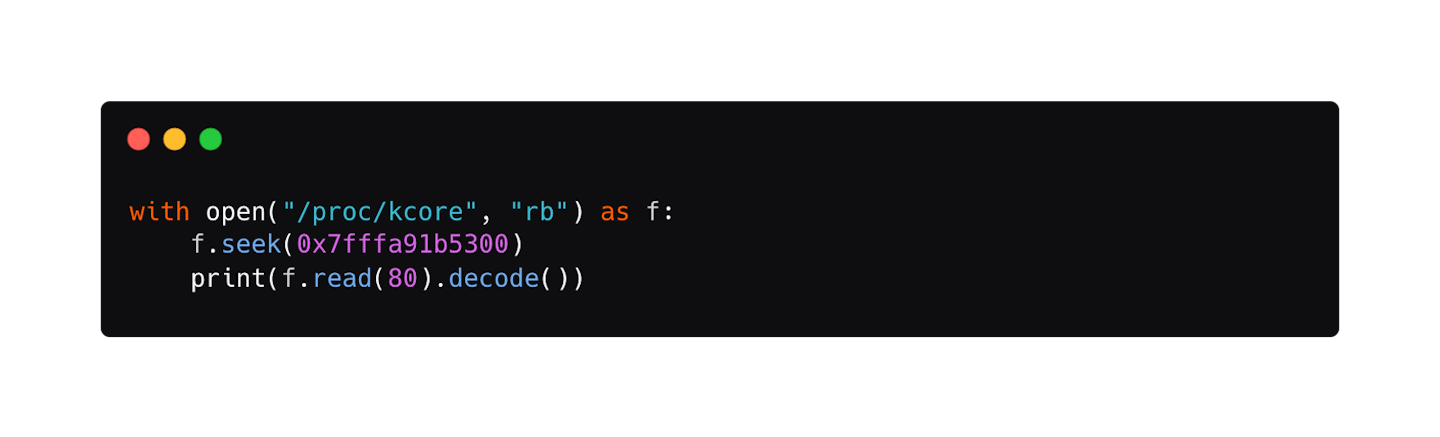
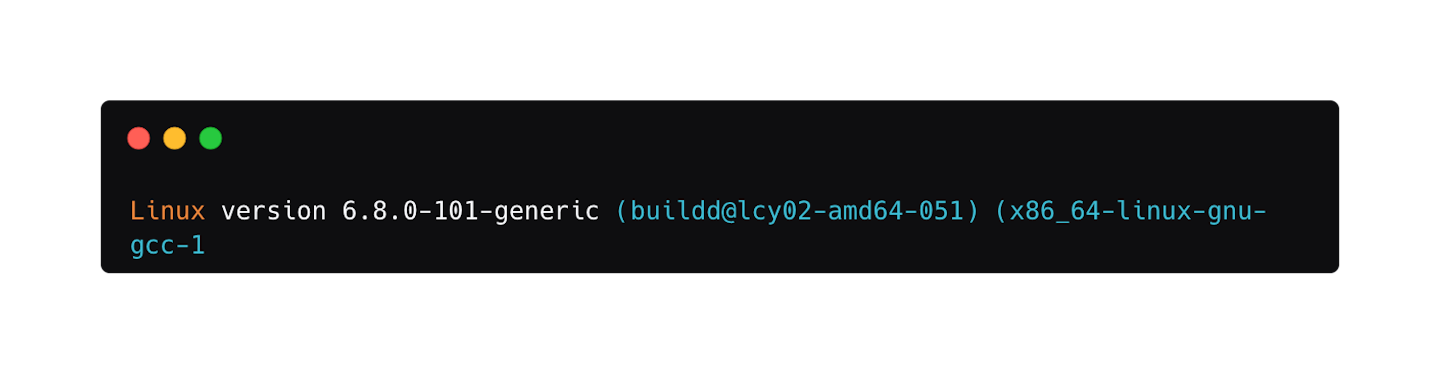
Let's see it in action. linux_banner is a kernel global holding the version string. First we look up its address in /proc/kallsyms:
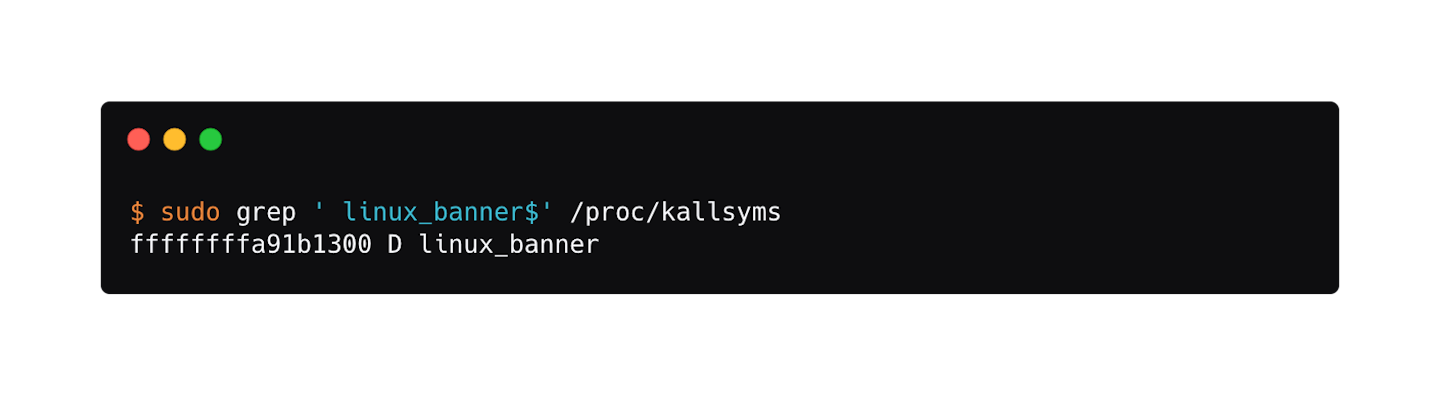
That address falls inside the first PT_LOAD segment from the readelf output above (VirtAddr 0xffffffffa7a00000, Offset 0x7fffa7a04000), so its file offset in /proc/kcore is:
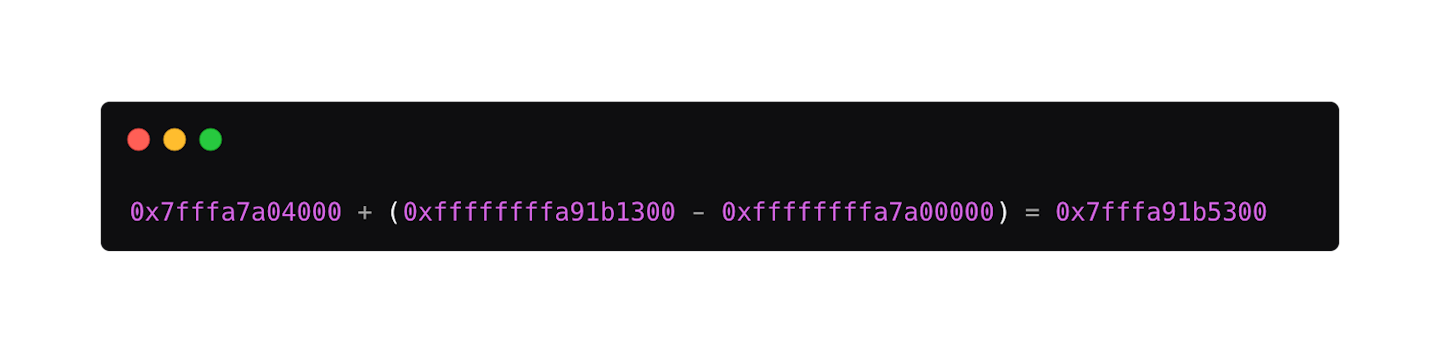
Seek there and read:
Introspection as a Python library
A symbol table, type information, and an interface for reading kernel memory are the raw materials a live-introspection tool needs. drgn, a Python library for kernel debugging first released in 2018, is what stitches them together.
Omar Sandoval and the drgn contributors built it around a simple decomposition: a C core that reads memory and resolves symbols and types, and a Python API that surfaces kernel structures as Python values with their C types preserved. Whether you're in the interactive REPL, running one of the shipped scripts, or embedding drgn in a larger program, the interaction with kernel state happens through that API.
Enumerating every process on the box takes five lines of drgn:
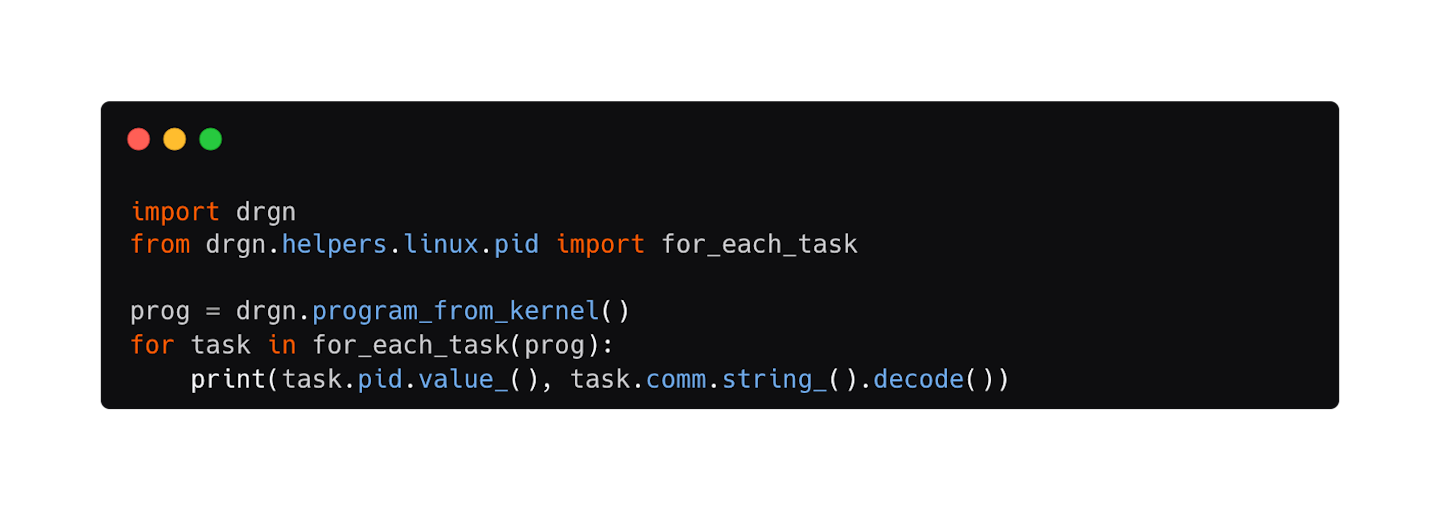
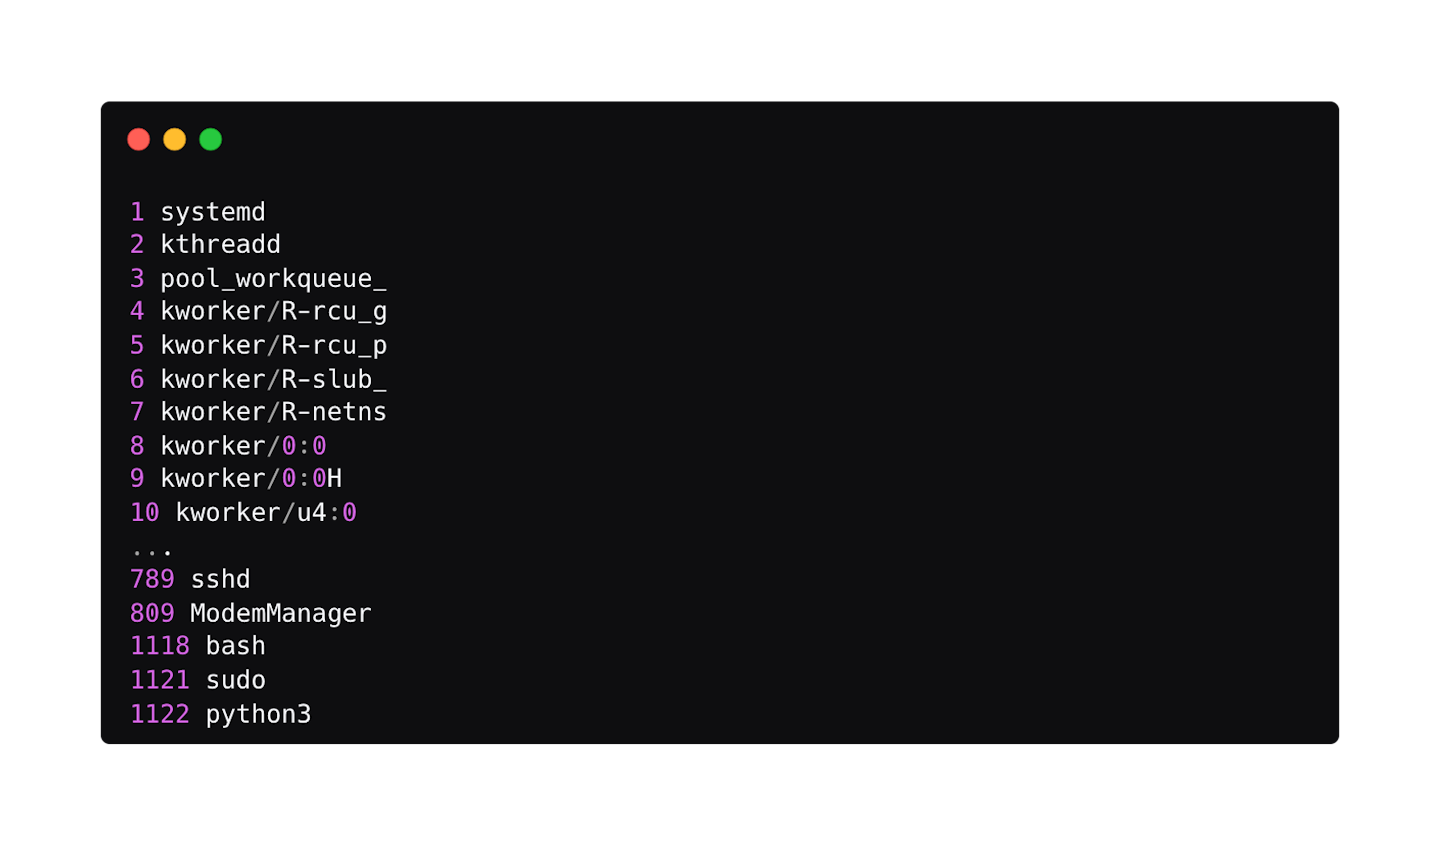
drgn.program_from_kernel() opens /proc/kcore, locates and loads the matching kernel debug symbols and type information, and returns a Program, drgn's handle to that particular kernel. for_each_task(prog), one of drgn's shipped helpers, walks the kernel's task list and yields each task_struct in turn. task.pid and task.comm access those fields the same way you'd access them in C, and .value_() and .string_() unwrap drgn's typed references into a Python int and bytes respectively.
Every kernel structure comes back as a value you can navigate the same way you would in a live C program. That's what having type information for the kernel buys.
drgn also ships a wide collection of helpers on top of the API. The simple ones iterate common kernel data structures like linked lists, radix trees, and the task list. The more powerful ones walk the loaded BPF program registry, enumerate slab caches, list any task's open file descriptors, or read the userspace memory of any process on the system.
The catch, and what's to come
The drgn session from the last section leans on four things, none of them obvious from the code:
Root on the reading machine to open
/proc/kcoreand/proc/kallsymswithout restriction.A cooperating kernel that serves those files honestly. Nothing in the interface stops a kernel-mode rootkit from filtering what it returns.
A matching debug-symbols package installed on the reading machine, built from the same kernel source and configuration as the running kernel.
Host CPU cycles to run drgn and issue every memory read.
One of these is a trust issue. A security tool that runs inside the environment it monitors is only as trustworthy as the rest of that environment. A kernel-mode rootkit can filter /proc/kcore or /proc/kallsyms the same way it can hide entries in /proc/modules or subvert bpf(). This isn't specific to neoclouds. What sets neocloud apart is that a compromised tenant kernel is a plausible threat model assumption, not an edge case. Anything the provider builds has to hold up when the kernel isn't on their side.
The other three issues are about deployment. On machines you run yourself, you have root, debug packages for the running kernel are usually a package-manager install away, and host CPU is yours to spend. That covers a personal Linux box, a company laptop, and a corporate server fleet alike. In a bare-metal neocloud, the OS belongs to the tenant, so the provider has none of them. There's no root on a machine the tenant owns, no matching debug package for a kernel the tenant might have built themselves, and no host CPU to spare when host CPU is what the tenant is paying for.
Over the rest of the series, we'll take on all four issues. In the next post, we'll relocate the memory-reading side of the drgn session onto hardware the provider already deploys in most modern GPU servers. That hardware sits outside the host's trust boundary and can read host memory directly over the PCIe bus. Attached to it, drgn won't need root, won't rely on a cooperating kernel, and won't consume host CPU. The final post will address the last requirement, a matching debug-symbols package. Modern Linux kernels ship enough of their own type information that a matching distro package is no longer necessary. By the end, you'll be running the same drgn session against every host in a neocloud fleet, from a vantage outside the tenant's control, on kernels the provider has never seen.